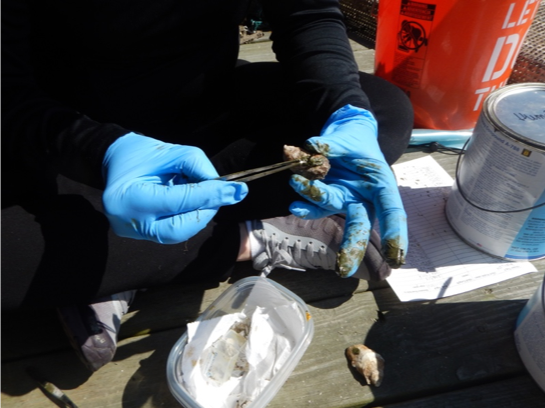
We are collecting oyster growth data in order to have information to help fit energy-based oyster growth models for Rhode Island coastal waters. In the beginning of May, we went out to each of the farm sites and tagged 30 oysters and deployed temperature loggers.
Selecting the Tagging Method
Dr. Lindsay Green-Gavrielidis applies PIT tags to oysters with epoxy. Photo credit: Celeste Venolia
We had talked over a variety of potential tagging methods to track individuals over time and ended up going with PIT tags cemented to the oyster shells in epoxy because we were able to borrow at PIT tag reader from another lab at URI, and there is little risk of tags falling off the oysters. PIT stands for passive integrated transponder and the tags essentially function like barcodes. I recommend this piece from the journal Nature’s Knowledge Process if anyone wants to learn more about PIT tags. Working with the epoxy was like dealing with a swampy glue monster, but it made for very sturdy tags on the tops of the oysters.
The Art of Measuring an Oyster
We return to measure the oysters growth every month. The measurements we take are shell height and shell length. What height and length mean in relation to an oyster is not very intuitive. Shell height refers to the measurement from the umbo (the high point near the hinge of the two shells) to the farthest away point, and shell length refers to the widest distance roughly perpendicular to shell height. Shell height is the main measurement that most individual-based models in existence predict. The impression I have gotten talking to farmers is that rounder oysters are better for market, so it is also interesting to track shell length.
Left: Tagged oysters at Cedar Island Oysters at Point Judith Pond, RI. Right: MS student Celeste Venolia demonstrates how to measure oyster shell height. Photo credit: Lauren Josephs
Written by: Celeste Venolia


